Demos
Demos


- Highlights
- A quality score difference of at least 5% at two years interval is more likely associated with an improvement of the saving rate
- The fact that ACOs can be motivated to deliver healthcare services of low health-related utility to keep and increase the beneficiaries’ satisfaction level can lead to decreasing trend of saving improvement rate over a quality improvement of 5%
- An incremental increase in quality (probably of 5%) in conjunction with a better control on the provision of low-value health services can be more beneficial to ensure a better correlation of what is delivered to ACO beneficiary population and the needs of the population, and so on saving more.
- Introduction
Following the Patient Protection and Affordable Care Act, known as Affordable Care Act (ACA) and nicknamed Obamacare, which was enacted in 2010 and the Health Care and Education Reconciliation Act, enacted in the same year, the first Accountable Care Organization (ACO) model, the Pioneer model, started in 2012. 32 ACOs enrolled in the first performance year and after a period of follow-up of 5 performance years 9 only 9 ACOs remained in the program in 2016. The Pioneer ACO Model was designed for healthcare organizations that were already experienced in coordinating care across different settings. At the same time, in 2011 the Medicare Shared Savings Program was established with the purpose of developing Accountable Care Organizations (ACOs) and its first cycle started 2012 with its first performance year with 27 of healthcare organizations enrolled, 5 of them participating in the Advance Payment Model, developed with the purpose of to encourage rural and physician-based ACOs to participate in the Shared Savings Program. In January 2017 The Centers for Medicare & Medicaid Services (CMS) announced its seventh cycle with 100 new organizations of a total of 178 for this cycle and the total number of 480 ACOs for 2017. The number of 480 organizations includes the 178 organizations enrolled for the seventh cycle. ACOs are groups of healthcare providers (physicians, hospitals) bound together by an executive authority and that need to include primary care providers because beneficiaries are attributed to ACOs based on their use of primary care services.
According to The Centers for Medicare & Medicaid Services “the intent of the Shared Savings Program is to promote accountability for a population of Medicare beneficiaries, improve the coordination of FFS items and services, encourage investment in infrastructure and redesigned care processes for high quality and efficient service delivery, and incent higher value care” for ACOs. The three-part aim: better health for individuals, better health for population and lower growth in expenditures are monitored through financial results, quality results and measures of health risks among the beneficiary population. Based on the assessment results at the end of a performance year an ACO can benefit, depending on the beneficiary population size, financial savings and the overall quality score, but regardless of the population health risks level of 10-50% share of savings for ACOs that chose to enroll in Track 1 and of 15-60% for those that enroll in Track 2 of the Shared Savings Program. At the same time, the ACOs that opt for Track 2 and are generating losses over an annual (performance year) limit of 5%, 7,5% and respectively 10% must repay 40-60% share of loss.
Because the Medicare Shared Savings Program main incentive is the proportion of savings an ACO can gain, which calculation is based on the saving rate and quality score obtained at the end of a performance year, the focus of its leading authority must be on achieving a good saving rate and at the same time a good quality score. The quality score is calculated based on the individual score achieved for measures grouped in 3 quality domains: patient/caregiver experience, care coordination/patient safety and preventive health. CMS added to the shared saving rate the second incentive, based on the Improvement Change Score, calculated as the difference of the score for a measure in a performance year and the score the previous performance year. Based on the level of the Improvement Change Score an ACO can receive up to 4 points for each domain within the maximum limit of points for every domain. The second incentive, being directly linked to the main (financial) incentive implies a greater focus on quality improvement, involving greater patient satisfaction level, improved hospital admission management, improved prevention services management. Among the positive effects should be the limitation of induced consumption of healthcare services, prevention of duplicate services and improvement of disease prevention at an individual level. Because the patients’ expectations and needs are not always the same, the healthcare services providers, in order to keep a good satisfaction level among their healthcare consumers, can be forced to deliver health services with a low utility, in these cases. Giving all these effects the improvements in quality score should be positively correlated with the saving rates improvements between performance years and can be negatively correlated if a great “effort” is made to satisfy the health consumers expectations.
The article aim is to display how the quality improvements or changes from a performance year to another and evolution of saving rates between the same years and if there is a point in quality improvement from which the correlation between the two indicators becomes negative.
- Methods
In order to compare quality improvements/changes and the saving rates improvements/changes between two sets of data belonging to two performance years, the indicators from 2016 and 2014, of 147 ACOs enrolled during the period 2014-2016, were compared. The reason why 2016 and 2014 data were chosen are: the last data available are for the year 2016, the number of ACOs enrolled and for which the data are available for 2016 and for a previous year, is greater when the comparison year is more close to 2016, 2014 is the last year for which the number of ACOs enrolled in both years (2016 and 2014) with available data for the analyzed indicators is a significant one. The last reason is the fact that by choosing 2014, and not 2015, the differences between years for the two indicators should be more visible.
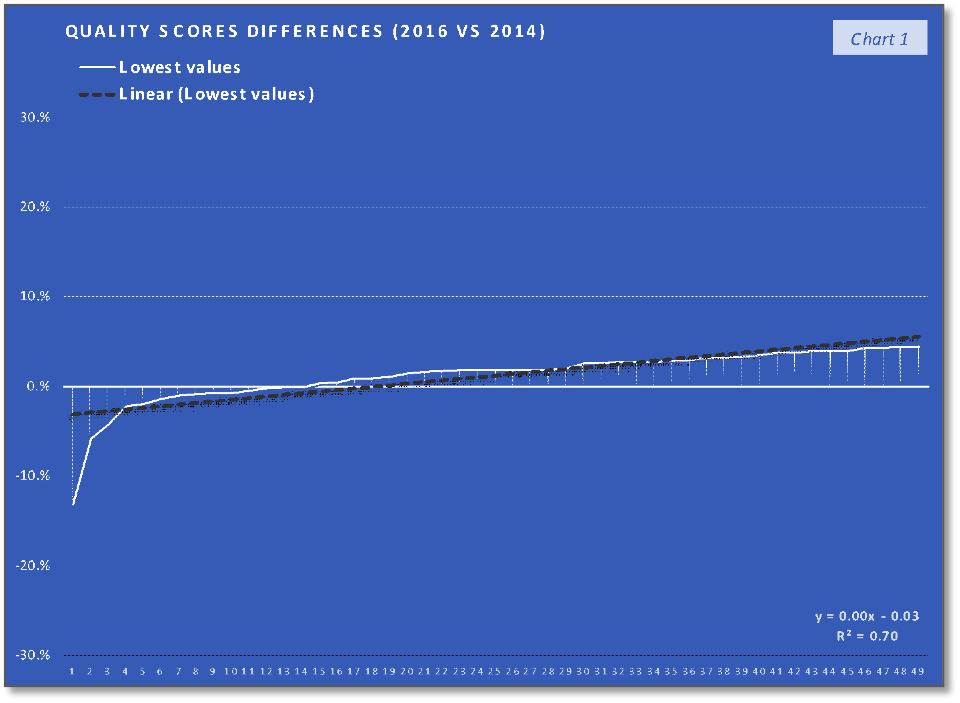
The differences between the 2016 and 2014 values, for overall quality scores and saving rates, were sorted by the overall quality scores, the overall quality scores differences being in this way ordered from the smallest to the largest. To assess the relation of the saving rates improvement/change, in 2016 compared to 2014, with the overall quality scores improvement/change in the same period in a way that takes into consideration the degree of quality scores changes, the values of the 147 ACOs were divided into 3 groups. Each group consists of 49 ACOs and can be characterized as follows:
- the group containing the 1st third of the overall quality scores differences, with the lowest ones
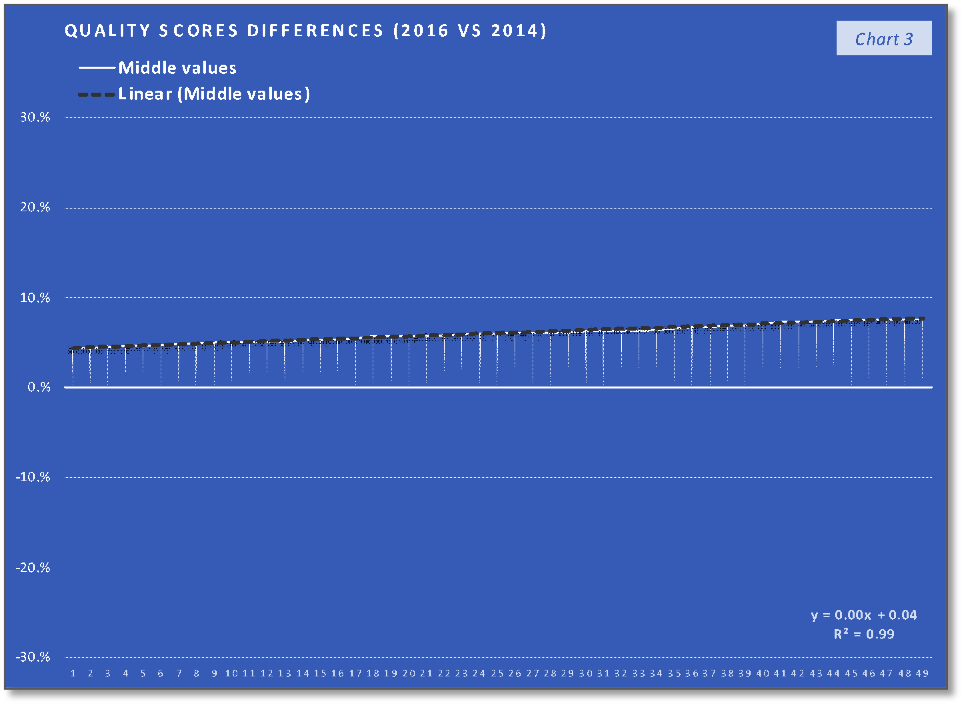
- the group of the 2nd third of the overall quality scores differences, with the middle values
- the group of the 3rd third of the overall quality scores differences, with the higher values
- Results and conclusion
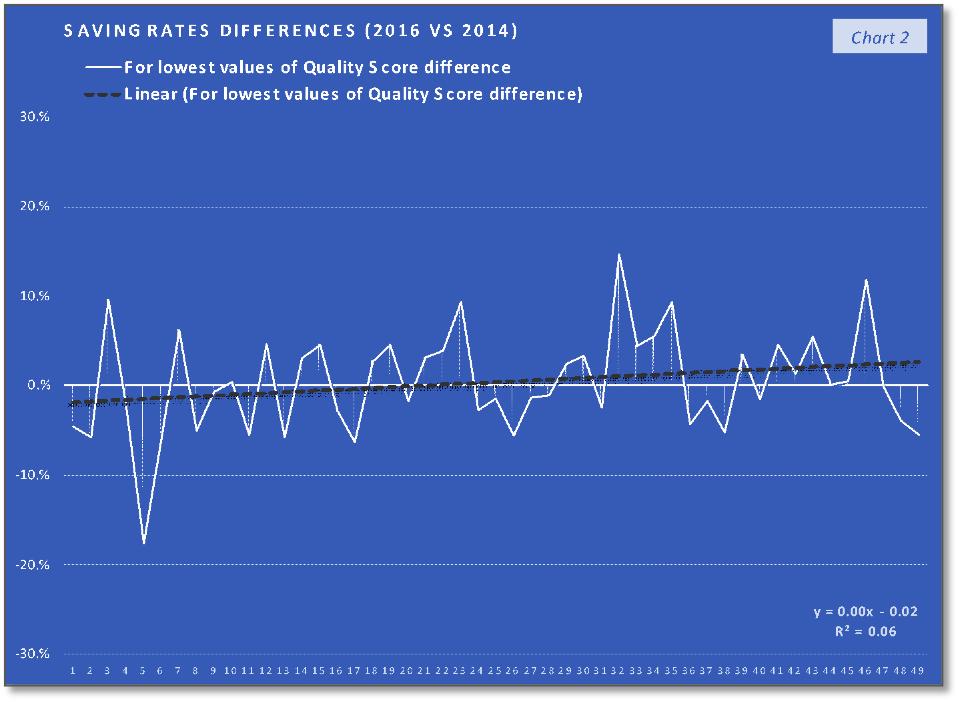
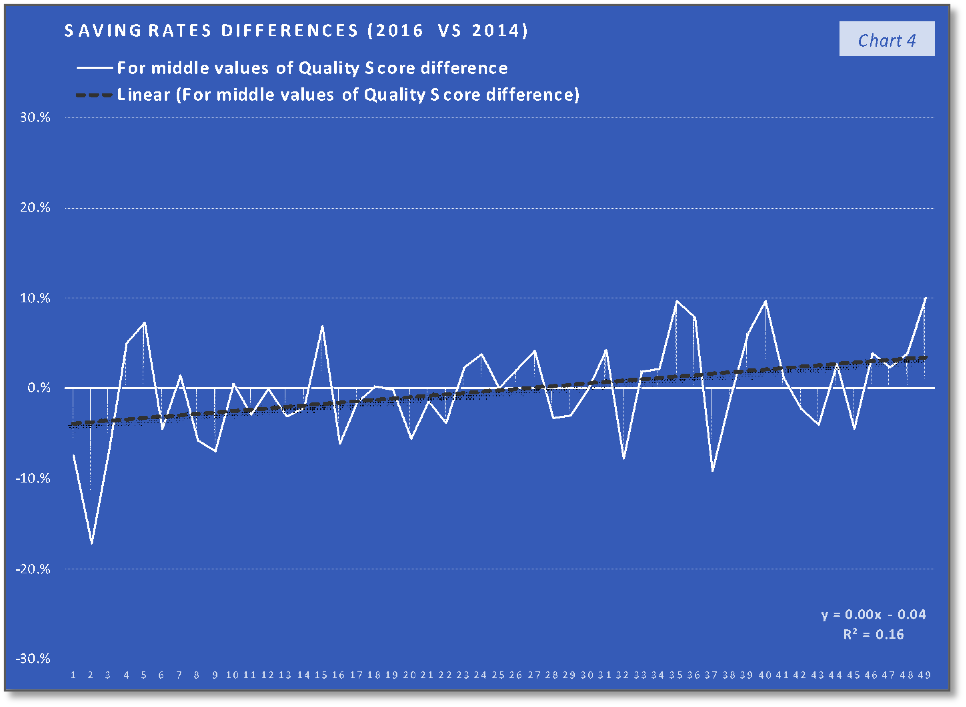
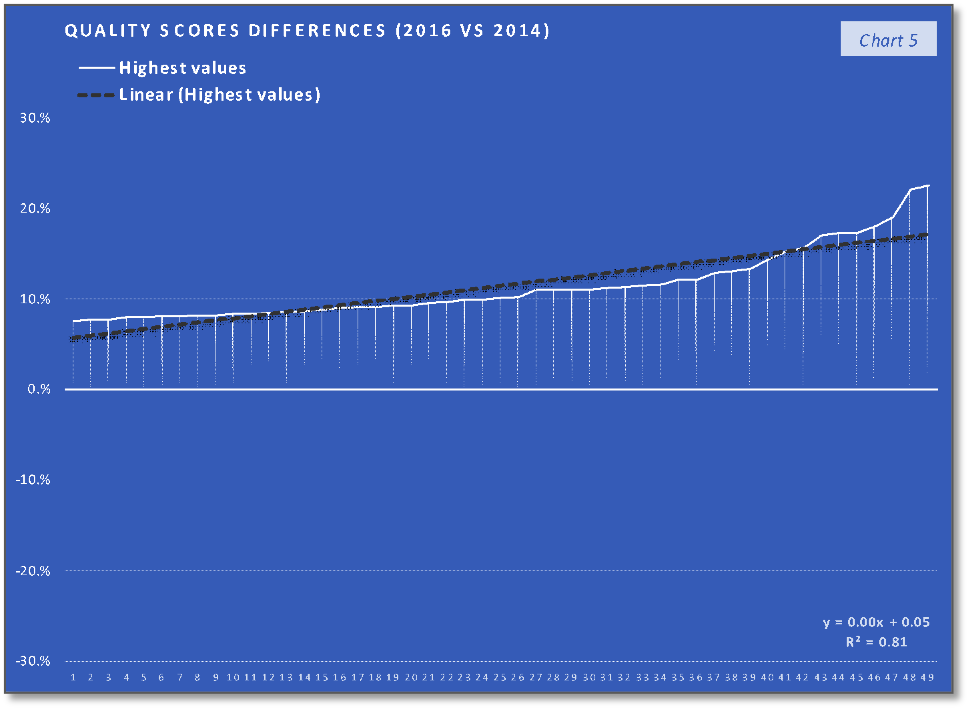
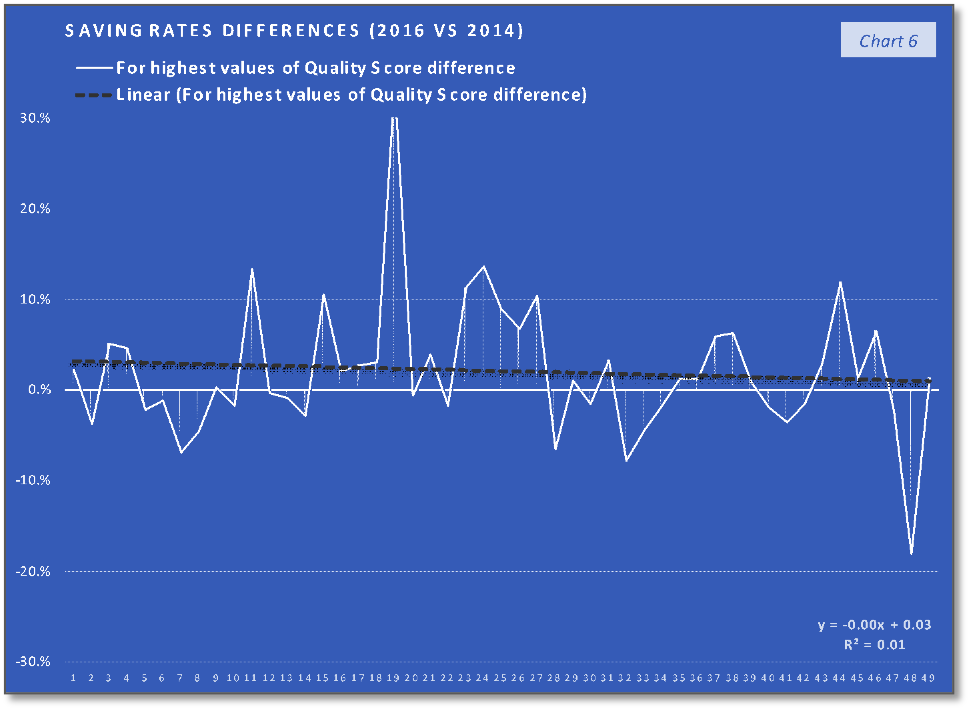
The ACOs group with 1st third of the quality scores differences values (the lowest values) trend and their corresponding saving rates differences trend, that can be saw in the first two charts, indicate the fact that the trend of the lower quality changes in the performance year (PY) 2016, compared with the PY 2014, are associated with a relatively similar slow increasing trend. In the case of the second group, charts 3 and 4, the middle-quality scores differences values (all positive), with a trend line having the interceptor at 4% (0.04 in the equation), are associated with saving rates differences having a similar increasing trend (line) but with the interceptor at -4% (- 0.04). The last two charts indicate that the highest quality scores differences values are associated with a slow decrease in saving rates differences trend. At the same time, if we consider the 19th value (of 34%) an outlier, the decreasing trend will keep existing if we replace this value with one of the others high positive values. What can be observed analyzing only the charts with the saving rates differences is that the increasing trend in the charts 2 and 4 stopped in the last chart (6) and at least after a visual analysis we can say that after quality score difference limit the positive effect of quality improvement on the saving rate will stop. According to the chart 5 trend line interceptor (0.05 in the line equation), this value can be around 5% difference in quality score improvement on two performance years interval. At the same time, because the trend line in the last chart is the only one that is doesn’t intersect the abscissa and placed above the abscissa a can be concluded that above the same limit of 5% difference in quality score improvement is a “safe zone” or a “low risk zone” for saving rates improvements.
As a preliminary conclusion, a difference in the quality score of more than 5% can ensure positive saving rate difference and that the maximum impact of quality improvement on the saving rate improvement is achieved more likely when the difference in quality score is closer to the value of 5%. This means that over the limit of 5% in quality score improvement the increase is based on the same on a mechanism which has a negative impact on the saving rate (improvement). The already mentioned fact that the healthcare providers can be motivated to deliver services that have a low health utility because of the differences between patients’ expectations and needs, can be one of the mechanisms that are causing healthcare services overconsumption.
According the study “Changes in Low-Value Services in Year 1 of the Medicare Pioneer Accountable Care Organization Program”1, which compared the “use of low-value services between Medicare fee-for-service beneficiaries attributed to health care provider groups that entered the Pioneer program (ACO group) and beneficiaries attributed to other healthcare providers (control group)”, the reduction in low-value health care services (“services that provide minimal clinical benefit” 1) during the first year of the Pioneer Program, was a modest one. The study emphasizes the fact that the Shared Savings Programs doesn’t offer incentives to limit the consumption of this type of healthcare services, which combined with the incentive to promote access to satisfactory health services will not favor the reduction of healthcare services of low health-related utility.
As a final conclusion, an incremental increase in quality (probably of 5%) in conjunction with a better control on the provision of low-value health services can be more beneficial to ensure a better correlation of what is delivered to ACO beneficiary population and the needs of the population, and so on saving more.